Chief operating officers should rely on optimized and insightful dashboards.
Key Takeaways:
● The Chief Operating Officer (COO) closely monitors day-to-day operations and trends.
● COO dashboards and reports condense important information into easily digestible formats.
● Customized COO dashboards and reports are tailored to address specific facets of the business.
● Choosing the right combination of software and metrics ensures decision-making and communication processes are optimized.
With their finger on the pulse of day-to-day operations ranging from production and sales to quality and resource management, the demanding role of the Chief Operating Officer (COO) is all about information. The COO must have easy access to real-time data and KPIs in an easily digestible format. COO dashboards and reports are essential tools for converting disparate data sources into actionable insights and well-informed decisions.
In this blog post, we review the basics of COO dashboards, reports, and other tools to better understand how they can streamline operations and increase efficiency.
The Importance of data-driven decision-making for COOs
Top executives rely on their intuition and experience while making dozens of critical decisions each day. Data-driven decision making supplements their sound judgment and gut feelings with the accurate numbers and analysis needed to make informed decisions. For the busy COO, data often comes in the form of dashboards and reports providing focused operational, financial, and workforce metrics and KPIs that encompass:
● Sales and deliveries
● Resource utilization
● Inventory turns
● Operating expenses
● Employee productivity
The information pulled from dashboards and reports supports strategic planning by allowing the COO to identify and react to trends and opportunities quickly. The insights they gain feed into important decisions like resource and employee allocation, expansion plans, and improvement initiatives that align observations with business goals.
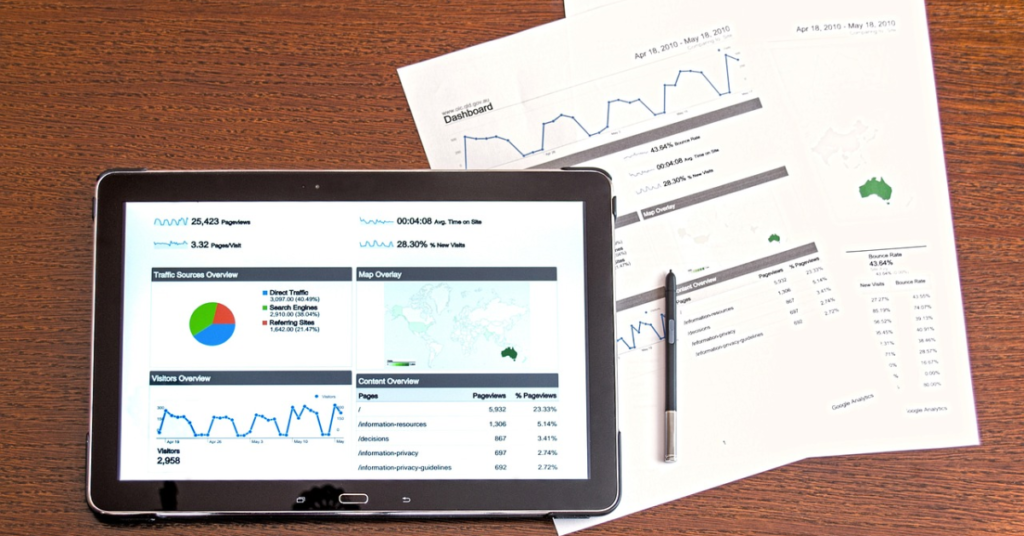
Understanding dashboards and reports
The term dashboard is used to describe any interactive user interface that provides a consolidated view of essential information. Reports often contain the same data, graphics, and KPIs found in dashboards, but present them with more detail and in a static format intended for distribution and historical review purposes. COOs also use reports to share important information based on a periodic snapshot in time.
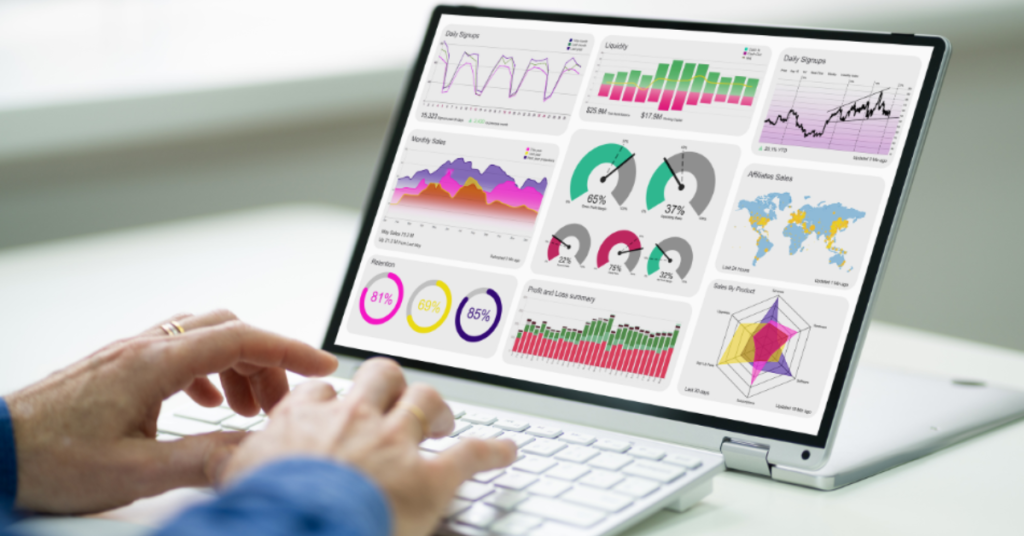
Executive dashboards used by CEOs, COOs, and other C-level executives typically include the following features:
● Key performance indicators prominently displayed
● Charts and graphs for selected metrics and trends
● Filters and dropdown menus to customize the view or time period
● Configurable widgets containing specific subsets of information
● Color coding and alerts to signify critical information or deviations
Static reports that mirror, supplement, and document the contents of a COO dashboard might also include the following elements:
● Executive summaries
● Historical perspectives
● Impact analysis
● Recommendations
The benefits of dashboards and reports for COOs
Dashboards and reports serve a similar purpose by condensing large amounts of information into a format that is easy to understand. Dashboards provide access to key metrics in real time and allow you to drill down to important details easily, while reports establish a format for communicating this information throughout the organization. The benefits of dashboards and reports also include:
● Improved decision-making
● Efficient monitoring of KPIs
● Enhanced collaboration and communication
The efficiency gained through real-time data and one-stop monitoring also saves the organization time and money by ensuring accurate metrics and trends feed into optimized decisions. The efficiency improvements also extend to reporting when dashboard software includes convenient, automated report generation and distribution features.
Types of COO dashboards and reports
The multi-faceted COO role varies between industries and companies. With the CEO busy maintaining the external face of the organization, leadership responsibilities associated with day-to-day operations and strategic growth often fall to the COO. The diversity of responsibilities might entail the use of specific dashboards and reports such as:
● Financial dashboards and reports to monitor profits, expenses, and revenue
● Operational dashboards to track efficiency and output
● Sales reports to review conversions vs sales targets
● HR dashboards to support talent management
Customized or industry-specific COO dashboards and reports might also be created. For example, a small package delivery firm might create a dashboard focused on delivery times, vehicle utilization, on-time delivery rates, and vehicle fuel efficiency, among other metrics.
Building effective COO dashboards and reports
With so much relevant data available, how do you decide what to include (or exclude) in a COO dashboard? In general, metrics and KPIs that have the highest impact on the strategic goals and objectives of the company should always be tracked. If sales growth is the number one business goal, sales metrics and trends should be featured prominently as you design dashboard and report layouts.
There are many outstanding dashboard and report tools available on the market. Choosing the right COO dashboard software means identifying a solution with robust graphical capabilities, ease-of-use, customization, and data security features that best suit your business needs.
Seamless integration with existing systems, including enterprise resource planning (ERP), customer relationship management (CRM), accounting, and human resources is also essential. Choosing an optimized combination of software tools and metrics makes it easier to interpret and report results.
Beyond dashboards and reports: Other tools for COOs
COO dashboards and reports are part of a growing list of available tools that enhance productivity and decision-making for the chief operating officer with the help of advanced computer technology and real-time data.
The COO can leverage risk management software to convert key operational, security, and competitive threats into actionable insights and plans. Business intelligence and analytics platforms support deeper dives by integrating diverse data sources and identifying important patterns and trends.
Collaboration platforms (Slack, Teams, etc.) are invaluable for sharing insight and information across geographies, and workflow automation tools streamline business practices by automating repetitive tasks. The rapid development of artificial intelligence (AI) will continue to improve the breadth and performance of the complete COO toolkit.
COO Dashboard FAQs
What is the difference between a dashboard and a report?
COO dashboards are interactive software tools that convert real-time data into summarized operational metrics, often using visual formats. COO reports combine detailed operational metrics with written analysis and insights to be distributed within the organization.
What are some common KPIs that COOs track?
There are many different metrics and KPIs tracked by COOs that span multiple categories. Some of the more commonly tracked metrics include working capital, inventory turnover, cash conversion cycle (CCC), procurement ROI, and employee turnover rates.
What are some best practices for designing effective dashboards and reports?
An important best practice for COO dashboard and report design is prioritizing substance over style to make key metrics accessible and understandable. Additional design best practices include a careful consideration of the intended audience, the inclusion of drill down features, and design collaboration with other stakeholders.
What are some common mistakes to avoid when building dashboards and reports?
Overloading COO dashboards and reports with too much information is a common mistake. Another frequent misstep is failing to align dashboard content with the most important goals and objectives of the organization.
What are some emerging trends in COO tools and technology?
Artificial intelligence (AI) will continue to underpin many of the new technologies behind COO tools. Voice-recognition and natural language generation (NLG) features will make dashboards more interactive. Predictive analytics will allow trends to be identified faster, while machine learning will enable dashboards and reports to adapt to changing business priorities automatically.
References
https://dotnetreport.com/blogs/executive-dashboard/
https://www.ibm.com/docs/en/netcoolomnibus/8.1?topic=hub-working-widgets
https://www.mckinsey.com/capabilities/operations/our-insights/stepping-up-what-coos-will-need-to-succeed-in-2023-and-beyond
https://www.makeuseof.com/how-to-choose-reporting-tool/
https://www.investopedia.com/terms/c/cashconversioncycle.asp
https://www.resolver.com/blog/benefits-of-risk-management-software/
https://blog.hubspot.com/marketing/workflow-automation
https://www.datapine.com/blog/coo-dashboard-report-template/
https://www.marketingaiinstitute.com/blog/the-beginners-guide-to-using-natural-language-generation-to-scale-content-marketing